An AI reporting assistant connects to GA4 and Google Ads and turns client metrics into instant answers via a conversational interface. Using RAG, it explains KPI shifts, trends, and campaign results based on real data and agency standards, cutting reporting time, shortening calls, and boosting account manager productivity.
Our client, a digital marketing agency, runs performance campaigns for a cross-vertical clientele. They convert analytics into practical cognizance through clear reporting standards that keep client discussions grounded in the data.
Business challenge
Despite having dashboard access, the agency’s clients repeatedly asked the same questions each reporting cycle: why metrics changed, whether spikes or drops were expected, and how to interpret short-term fluctuations. Account managers spent time re-explaining identical KPIs across channels, making routine reporting unnecessarily resource-intensive.
The team needed a system that could interpret performance changes in real time without replacing human judgment. It had to ground every answer in actual GA4 and Google Ads data while following the agency’s established reporting playbook. The setup needed to let the team update definitions and explanations as reporting standards changed, without model retraining or engineering work, as well as keep each client’s data clearly separated.
Solution delivered
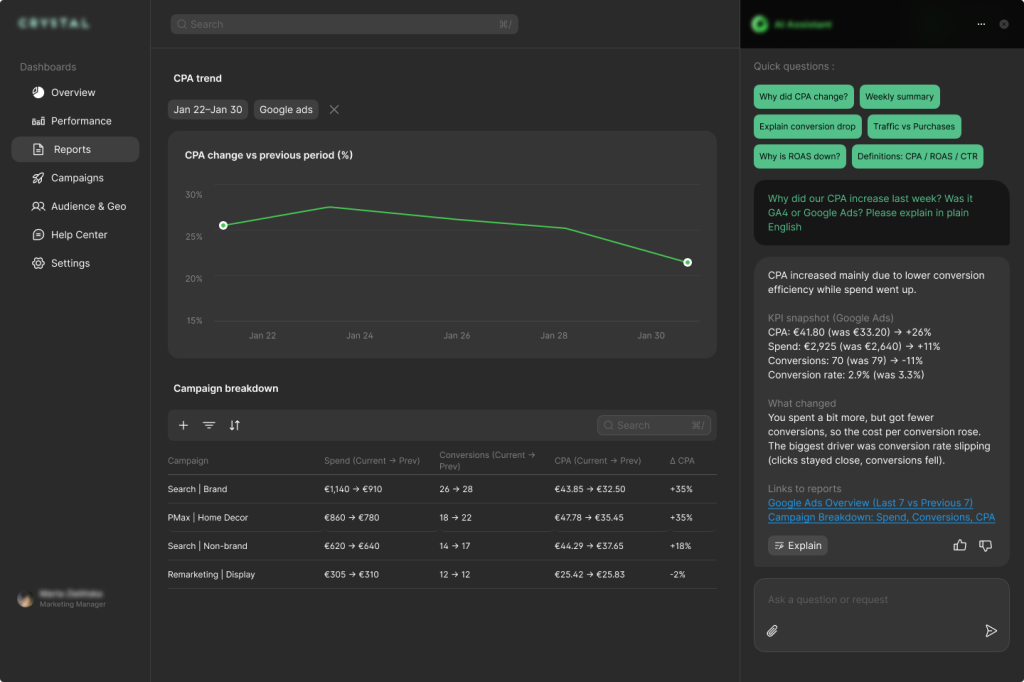
To address these challenges, GetDevDone’s engineers built a client-facing chatbot that responds to performance-related questions using each client’s real metrics and the agency’s established reporting language. It operates on top of a normalized reporting layer that aligns the KPIs already used in client conversations.
Core behaviors
The chatbot was set up to:
Answer KPI-specific questions
Produce weekly and monthly performance summaries
Explain metric changes by referencing the exact numbers and time windows involved
Each request is processed through a client-scoped data interface, so conversations only access the relevant account’s data.
Context-driven explanations with live data
When a question is asked, the system retrieves the relevant definitions, naming conventions, and explanation patterns from the agency’s reporting glossary and playbook. The response pipeline then combines this context with the underlying metrics to generate explanations that show what changed and how the numbers were derived.
Initial data source integration
GA4 and Google Ads were connected first, as they accounted for most recurring client questions, and both provide stable programmatic access through official APIs.
Key features & components
Structured access to performance data. Performance metrics are pulled from GA4 and Google Ads through a connector layer that gives each client clean, scoped access to their own reporting data.
Consistent KPI definitions. A lightweight reporting layer aligns KPIs with what teams already use in client conversations, so everyone works from the same definitions and calculations.
Strict client separation. All data access is client-scoped. The system only works with data from the active account, and conversations stay fully isolated between clients.
Shared reporting language. Metric definitions, naming conventions, and explanation rules live in one central place. This becomes the reference the system uses when answering questions.
Contextual, data-grounded explanations. For each question, the system applies the right definitions and context to the metrics, referencing the figures and time periods involved.
Embedded experience with admin control. The solution includes a chat inside the client portal, with a simple admin view that lets the team manage client mappings and update reporting rules without touching code.
Technologies & tools
Node.js / TypeScript, Firebase Functions: backend orchestration and API handling
GA4, Analytics Data API: analytics metrics retrieval
Google Ads, Google Ads API: paid media performance retrieval
Within six weeks, the chatbot was live, handling the recurring performance questions that had been taking up account manager time. Routine metric clarification moved into the client portal, reducing reactive support and freeing the team to focus on more strategic work.
More structured client conversations
By resolving basic metric questions ahead of meetings, client discussions were grounded in a shared baseline. This allowed conversations to focus on interpretation, implications, and next steps rather than revalidating numbers.
Consistent explanations across accounts
Metric explanations followed the same documented reporting rules for every client, regardless of which account manager set up the account. This removed variations in how KPIs were explained and improved confidence in the figures and concepts being discussed.
More time for higher-value work
With routine explanations handled by AI, account managers can focus their expertise on core issues like analysis, planning, and strategic client engagement.
Explore how we transformed BizDeva's vision into a stunning, functional WordPress website that captures the client's brand identity while enhancing user engagement.
Talk to a commerce advisor to define the right architecture, platforms, and growth model for your business.
Get guidance on configuration, scalability, and compliance — tailored to your market and goals.