- Case study, WordPress development
- 2 min read
Hotel website development
Learn the essentials of hotel website development to improve bookings, user experience, mobile performance, and guest engagement.
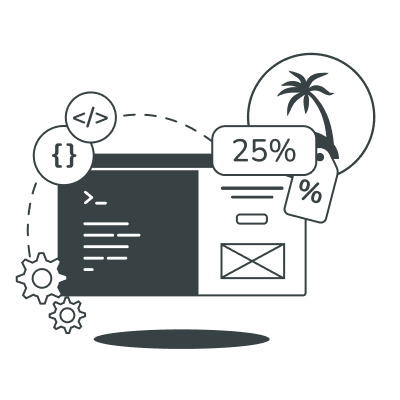
Discover how we built a custom Grafana dashboard to improve data visualization, reporting efficiency, and real-time business insights.

The client sought to evolve its data monitoring capabilities by upgrading its existing Grafana dashboards — particularly those tracking integration services health. The focus was on creating visualizations that not only deliver real-time insights but also reflect modern design principles and accessibility standards for a wide range of stakeholders.
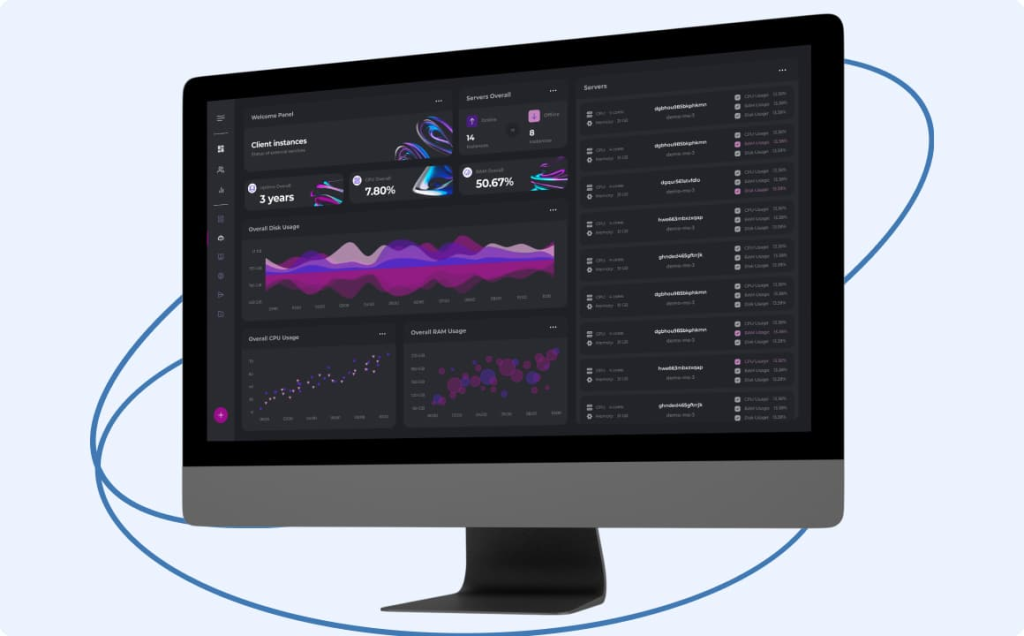
Develop customized Grafana dashboards with advanced design and analytical capabilities, supporting improved transparency, real-time decision-making, and a shift toward a data-driven culture in public sector operations.
Tech stack
Future plans
Conclusion
This project demonstrates P2H’s ability to deliver tailored, visually compelling, and functionally advanced dashboards. By aligning deep technical implementation with client vision and future-readiness, P2H delivered a solution that raises the bar for public sector data visualization.

Custom visualization systems built for enterprise operations.
Order now
Learn the essentials of hotel website development to improve bookings, user experience, mobile performance, and guest engagement.

Discover how we transformed the Winchester White website with custom WordPress development, plugin integrations, and improved functionality.

Explore how eCommerce platform development helps healthy product brands improve customer experience, sales, and business growth.